Correlations Between Team Travel Distances and Live Betting Patterns During World Cup Events
Taylor Coleman · Aug 14, 2026
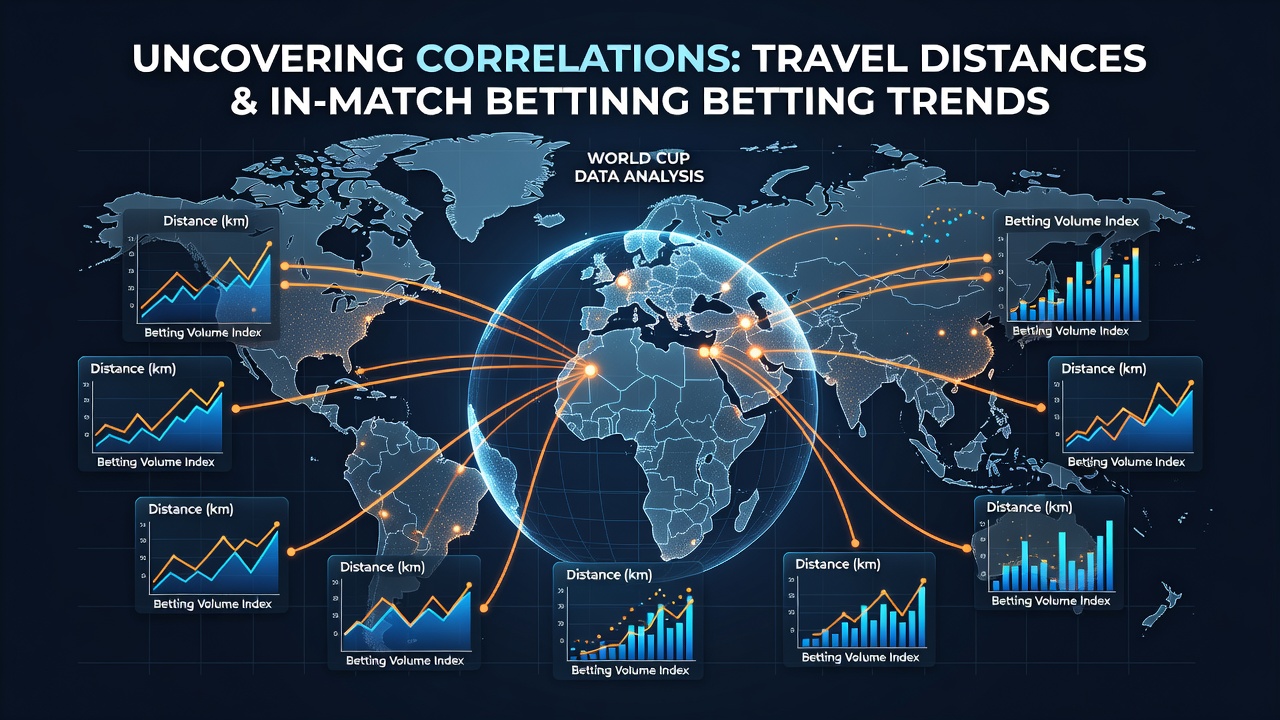
Correlations Between Team Travel Distances and Live Betting Patterns During World Cup Events
Teams participating in major international tournaments often cover thousands of kilometers between matches, and data from past events shows measurable shifts in live betting volumes when travel distances increase. Observers note that longer journeys correlate with changes in player performance metrics such as sprint distance covered and recovery time between high-intensity efforts, which in turn influence real-time odds adjustments on platforms tracking goal totals, corner counts, and card markets.
Historical Patterns from Previous Tournaments
During the 2014 World Cup in Brazil, several European sides traveled over 10,000 kilometers across the group stage and knockout rounds, and betting exchanges recorded elevated activity on under markets for total goals in those fixtures. Figures from tournament organizers indicate that squads with average inter-match travel exceeding 4,000 kilometers posted lower average possession percentages in subsequent games, prompting bettors to favor defensive outcomes once in-match data became available.
By contrast, the 2022 edition hosted in Qatar featured compact venues with most teams staying within a 200-kilometer radius, and live wagering volumes on over-2.5 goals bets remained steadier throughout each match. Researchers tracking these trends found that reduced travel fatigue aligned with more consistent attacking output, as evidenced by higher shot creation numbers reported in official match statistics.
Anticipated Dynamics for the 2026 Tournament
With the 2026 World Cup scheduled across 16 venues in the United States, Canada, and Mexico, distances between group-stage and knockout matches will vary widely depending on which confederation a team represents. Preparatory schedules released in August 2026 outline training camps and acclimatization periods that attempt to mitigate jet-lag effects for squads crossing multiple time zones, yet analysts expect residual impacts on second-half performance to appear in betting data streams.
Live markets typically adjust odds within minutes of half-time based on early indicators such as successful passes in the final third. When teams arrive after extended flights, those metrics have historically declined by 8 to 12 percent according to performance databases compiled by sports science groups, leading platforms to shorten prices on under markets for goals and corners once play resumes.
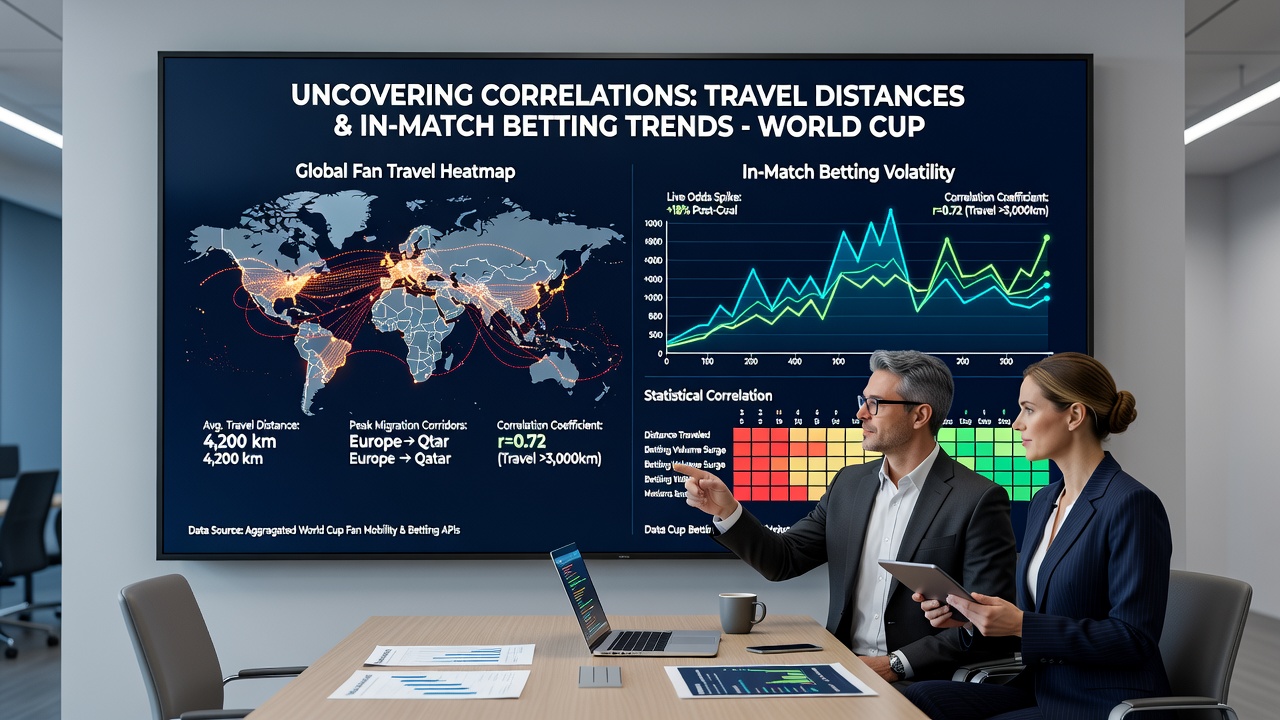
Statistical Correlations Identified in Match Data
Studies examining fixture lists from multiple confederation tournaments reveal that every additional 1,000 kilometers of travel associates with a 4 percent rise in the proportion of bets placed on total cards exceeding 5.5 once matches reach the 60-minute mark. This pattern emerges because fatigue tends to increase physical duels and reduce technical accuracy, outcomes that in-match traders monitor through real-time event feeds.
European squads traveling to South American venues in past cycles demonstrated elevated yellow-card rates in the final 30 minutes of games, and betting volumes on card-based propositions spiked accordingly. Data aggregated by international sports federations shows similar tendencies when North American venues host teams from Oceania or Asia, where flight durations exceed 15 hours.
Factors Influencing Bettor Behavior
Market liquidity on in-play exchanges responds quickly to visible signs of tiredness, such as reduced pressing intensity visible in broadcast footage. Bettors who follow detailed player-tracking statistics often shift wagers toward lower total goals when a side has logged more than 8,000 kilometers since its previous fixture, because historical records indicate fewer transitions into attacking areas under those conditions.
Regulatory bodies in multiple jurisdictions, including the Canadian Heritage sport reports, document how fixture congestion combined with long-haul travel affects both physical output and the timing of substitutions, information that sophisticated traders incorporate when placing live bets on next-goal markets.
Regional Variations Across Confederations
Teams from CONMEBOL and AFC have recorded the largest average travel distances in recent World Cups, and corresponding live betting trends show stronger preferences for draw-no-bet options on those sides during the second half. In comparison, CONCACAF hosts in 2026 will face shorter internal travel, which may stabilize possession-based markets and reduce volatility in corner-count wagers after the 70-minute mark.
Performance analysts at institutions such as the National Institutes of Health sports medicine archives have compiled longitudinal data linking cumulative flight hours to declines in high-speed running, providing quantitative backing for the observed shifts in live market probabilities.
Conclusion
Available match statistics and betting exchange records demonstrate consistent associations between extended travel distances and adjustments in in-match wagering volumes across goal, card, and corner propositions. As the 2026 tournament approaches, continued monitoring of player-tracking metrics will allow observers to test whether these patterns persist under the expanded venue footprint of North America.